hop 01 // about

Nduduzo Dlamini

Data Analyst & Engineer | SQL Server, ETL & AI Tooling

IT infrastructure foundation with experience in health information systems and data workflows.

My journey has always been about solving problems with technology. I started in IT, building hands-on experience in networking, systems support, and health information systems such as ELMIS, CMIS, and DHIS2. This foundation led me into data analytics and engineering, where I work with SQL Server, data transformation, ETL workflows , and reporting to turn raw data into reliable, decision-ready insights. Today, I'm expanding into AI tooling, data science, and cloud technologies, building practical solutions that connect data and intelligent systems to real-world challenges.

Portrait of Nduduzo Dlamini Data · SQL · ETL

hop 02 // selected work

Selected work

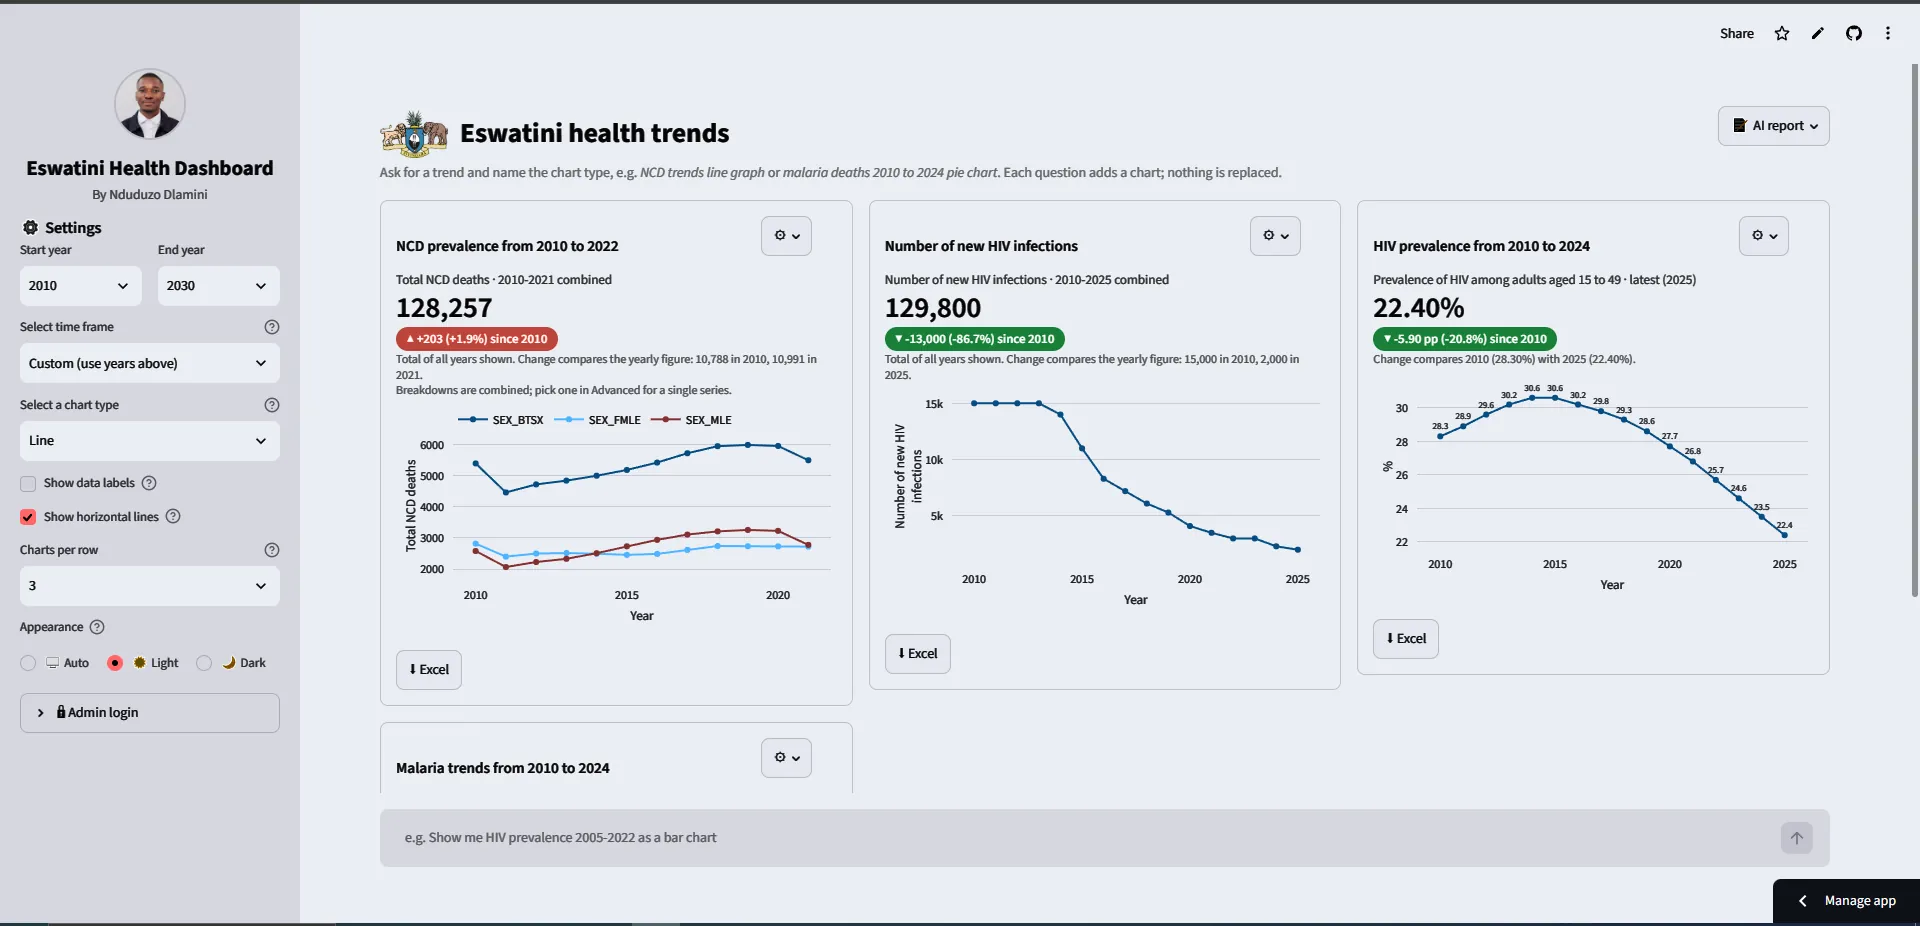
Data Analysis Projects

Dashboards and reports that turn public datasets into decisions — built with SQL, Python and Tableau.

View Data Projects

Data Science Projects

AI-driven text-to-SQL data pipelines — deploying local LLMs and relational databases to automate health reporting.

View Data Science Gallery

Networking Projects

Structured cabling, switch configuration and infrastructure support work, including HMIS fieldwork.

View Field Gallery

Development

Full-stack web applications and UI builds — developed using JavaScript, serverless logic, and secure databases.

View

hop 04 // experience

Experience

  1. 2025 – 2026

    Health Data & Systems Support

    Health Management Information System (HMIS)

    • Designed, debugged, and optimized a multi-stage T-SQL reporting pipeline (15+ staged tables) for a national PrEP (HIV Pre-Exposure Prophylaxis) program, integrating enrollment, follow-up, ART, medication, adverse-event, and population-classification data into a single clinical report.
    • Diagnosed and resolved structural SQL Server errors and corrected underlying clinical business logic (PrEP eligibility, ART status, stop reasons, seroconversion tracking).
    • Improved report runtime by eliminating redundant query branches, adding targeted indexes on staging tables, and replacing a row-by-row scalar function with a set-based equivalent.
    • Collected, cleaned, and validated data from electronic health records and other health systems to ensure accuracy, consistency, and completeness.
    • Built dashboards, charts, and reports in Excel and Power BI to present findings to healthcare providers and administrators; tracked public-health trends including disease outbreaks, vaccination rates, and population health metrics.
    • Used DHIS2 dashboards to review and validate regional health data as part of routine data quality checks.
    • Provided first-line (Tier-1) technical support, diagnosing and resolving hardware, software, and system-related issues for end-users.
    • Installed, configured, and maintained workstations, printers, routers, switches, and access points.
    • Monitored LAN/WAN connectivity and system performance, and managed user accounts, access permissions, and IT asset documentation.
    • Implemented file-sharing and backup systems for data availability and recovery, and maintained documentation of configurations and procedures.
    • Supported staff on digital health systems and collaborated across facilities to deliver timely IT infrastructure solutions.
  2. 2023 – 2024

    Web Developer Intern

    Nomad Stays

  3. Self-Directed

    Data Analytics — Independent Projects

    Personal projects using SQL, Excel and Tableau

    • Built an Excel dashboard for a pizza sales dataset (48,620 order lines, 21,350 orders, about $817,900 in revenue) using PivotTables and KPI measures, covering daily and hourly order trends, category and size share of sales, and best and worst sellers.
    • Cleaned and analyzed 1,000 bike-buyer records in Excel, adding age brackets and building PivotTables and a dashboard that show how income, age, gender and commute distance relate to purchases.
    • Ran exploratory analysis of an e-bike sharing dataset (15,000 trips, 25 stations, 1,000 users) in SQL Server using T-SQL, CTEs and window functions, covering peak hours, member vs. casual behavior, station popularity, net flow imbalance and user growth.
    • Built an interactive Tableau dashboard analyzing COVID-19 trends from public datasets.

hop 05 // qualifications

Qualifications

  1. 2022

    Bachelor of Information and Communication Technology (Honours)

    Durban University of Technology

  2. 2021

    Advanced Diploma in Information and Communication Technology

    Durban University of Technology

  3. 2017 – 2020

    Diploma in Information and Communication Technology (Application Development)

    Durban University of Technology

hop 06 // credentials

Certifications

Networking & Security

Data & AI

hop 07 // find me

Professional Links

hop 08 // end of trace

Let's talk

Open to data engineering, data analyst and IT roles — reach out any time.

Email me